Deep dive into the 1850-1900 Baseline, so that I can confidently produce graphics which are accurate using the Copernicus ERA5 data.
This work has resulted in a change to my graphics in June 2024 onwards, compared to my earlier work in Feb 2024.
Terms
| GMST | Throughout this page, I use the term “GMST” (Global Mean Surface Temperature), to refer to the “2 metre global average surface temperature” from the Copernicus ERA5 dataset. Copernicus supplies this GMST data for every day from Jan 1st 1940 up to the present. |
| GMST Anomaly | Difference between a GMST and the relevant baseline GMST. Examples: Annual “GMST Anomaly” for the year 2023, relative to 1850-1900 baseline was 1.48C Monthly “GMST Anomaly” for Dec 2023, relative to 1850-1900 baseline was 1.78C Daily “GMST Anomaly” for 11th Feb 2024, relative to 1850-1900 baseline was 2.00C |
Abstract
I was frustrated that there appeared to be minor inconsistencies when comparing my analysis, with Copernicus’ own published analysis.
I felt that this should not be possible:
- We are using the same underlying data.
- We are just subtracting one number from another:
- “Current temperature” vs “1850-1900 baseline temperature”
The differences were not big. Some of the monthly GMST Anomalies I was calculating were up to 0.05C different from those reported by Copernicus. It turns out that the technique for determining the Daily temperatures for the “1850-1900 baseline” was the issue. I found multiple ways of calculating the baseline temperatures (all supplied by Copernicus), and choosing the right one, was the key.
To sanity check my work, I am now comparing output from my calculations, against webpages hosted by Copernicus. These pages have published data for GMST Anomalies for specific years, months, days relative to 1850-1900 baseline. A few examples pages are below, but I am using a lot more references in my tests.
- Monthly Bulletins:
- Annual Bulletins:
- Analysis
Copernicus ERA5 – Daily GMST values
The Copernicus ERA-5 dataset provides up-to-date daily GMST, with only a few days delay, which is fantastic. I have found a few sources for this data (See Appendix A), but the data is always the same, so no issues getting a dataset with the Copernicus ERA-5 daily GMST for every day from 1st Jan 1940 until the present.
This GMST data is the actual temperature, not the “GMST anomaly”.
To calculate the anomaly, we need the daily global surface air temperature for the baseline period 1850-1900.
Copernicus ERA5 – Daily GMST 1850-1900 GMST baseline values
I have found 3 different methods to calculate the Copernicus 1850-1900 baseline (See Appendix B), each slightly different from the other, and choosing the “Trigonometry 1850-1900 Baseline Method” gave the best results. All three methods gave very similar results, and choosing one/other is only relevant if you are interested in analysis for sub-one-year GMST anomalies (E.g. for a month/week/day), with a high degree of accuracy.
Graphics Affected by Methodology
The graphic that is most affected, by this analysis is the one that calculates the number of days above various temperature milestones (1000 Days above 1.5C before Trend passes 1.5C?). The difference in baseline calculation method on average makes < 0.001 difference over a year, but individual days / months are up to 0.03 different. This means affects the counts for the number of days over (E.g. 0.5C, 0.75C, 1C, …). I hope this will be a one-off adjustment, and then future numbers will all use the same updated baseline.
Conclusions from my Analysis
- Copernicus supplies highly consistent daily GMST values from 1940 – present
- Copernicus supplies highly consistent daily GMST anomalies, relative to 1991-2020 baseline
- Copernicus don’t have their own data pre-1940, and therefore the Paris Agreement “pre-industrial” baseline needs to be calculated
- The period 1850-1900 is the baseline has become the de-facto standard for “pre-industrial”, (for the Paris Agreement).
- I have found 3 different sources, to generate the 1850-1900 daily GMST values, using data from Copernicus (See Appendix B)
- For all future graphics (Using Copernicus ERA5 data), I will be using the “Trigonometry 1850-1900 Baseline Method”
- Calculating yearly GMST anomalies, relative to 1850-1900 baseline
- If you want the GMST Anomaly for a whole year (or any multiple of 12 months), then the GMST Anomalies are solid, no matter which (of the 3 identified) methods is used.
- If you want a GMST anomaly for a sub-year period (month, week, day), then use the “Trigonometry 1850-1900 Baseline Method”
- Given that I have no relevant climate qualifications, my assessment of the best available method to calculate the daily GMST anomaly, is to identify the method that best matches the anomaly information published in Copernicus’s own bulletins and other published analysis articles.
- My future analysis will calculate the GMST Anomalies using the “Trigonometry 1850-1900 Baseline Method” to calculate the 1850-1900 baseline:
- Daily GMST for 1940-present taken from: https://sites.ecmwf.int/data/climatepulse/data/series/era5_daily_series_2t_global.csv
- Baseline 1850-1900 daily GMST calculated as follows, for each day of the year
- Non-Leap year Baseline 1850-1900 Daily GMST:
- Average 1991-2020 Copernicus daily baseline GMST calculated from “climatepulse” link above (For the desired day of the year)
- minus
- Where “B2” is the desired day of the year. E.g. 1st Jan = 1, 1st Mar = 60, 31st Dec = 365
- Average 1991-2020 Copernicus daily baseline GMST calculated from “climatepulse” link above (For the desired day of the year)
- Leap year Baseline 1850-1900 Daily GMST:
- Average 1991-2020 Copernicus daily baseline GMST calculated from “climatepulse” link above (For the desired day of the year)
- minus
- 0.88+0.05*sin((2*3.14159*(B2-0.5))/366)+0.07*cos((2*3.14159*(B2-0.5))/366)
- Where “B2” is the desired day of the year. E.g. 1st Jan = 1, 1st Mar = 61, 31st Dec = 366
- Average 1991-2020 Copernicus daily baseline GMST calculated from “climatepulse” link above (For the desired day of the year)
- Non-Leap year Baseline 1850-1900 Daily GMST:
- I now understand why the Copernicus Bulletins and Analysis pages, generally have the following format:
- Anomaly vs 1991-2020 provided confidently and accurately
- Copernicus are calculating an anomaly using only Copernicus data, and therefore they are confident to provide exact numbers
- 12-month period up to the current month. This allows for an accurate value relative to 1850-1900
- By choosing an 12 month period (or multiple of 12 months), any issues with the variations in the 1850-1900 baseline daily temperatures are averaged out, and cease to be an issue. Simply take the anomaly from 1991-2020 Copernicus data and add 0.88C.
- Anomaly vs 1850-1900 as “around X C”
- The word “around” covers 0.05C wriggle roomThe difference between the 1850-1900 baseline daily global average temperature and the 1991-2020 daily global average temperature is NOT a constant. In some days / months it is higher / lower than others.There are different ways of calculating the 1850-1900 baseline daily global average temperatures, leading to slightly different baseline values, and hence slightly different daily anomaly values.Over a single full year (or any multiple of 12 months), the issue goes away, and the difference between 1850-1900 baseline and 1991-2020 baseline is a constant (0.88C). This is true whether you compare a 12 month period starting 1st Jan, or starting a 36 month period starting 10th May (or any other date)
- Leap days are a bit confusing. Copernicus tends to treat 29th Feb baseline GMST as half way between 28th Feb and 1st March, which could have its own discussion / arguments. The “Trigonometry 1850-1900 Baseline Method” makes it easy to stretch a year over 365 of 366 days
- Anomaly vs 1991-2020 provided confidently and accurately
Disclaimer
As per the About page, this is a best-effort analysis. If you have found yourself wading through this analysis, and find any mistakes, misunderstandings, improvements, or can point me at someone who has done this better, let me know and I will adjust whatever needs adjusting. … Or indeed, I will retire of this page, and just point to that analysis. Generally a sign of good work, is that someone has already done it better.
Implications of my conclusions on the graphics I have been (and will be) creating
For my graphics, where I use Copernicus data to calculate daily and monthly GMST anomalies (E.g. to count number of days above 1.5C )
This page concludes that daily / monthly GMST anomalies (vs 1850-1900) have an accuracy of < 0.05C
This means that my graphics which count number of days (E.g. 1000 Days above 1.5C before Trend passes 1.5C?), the numbers are not exact, and should be treated as indicative.
I will bear this in mind, when creating graphics, to make sure they are resilient to this tolerance. E.g. The overall shape of the graphs are not affected by whether 14,818 days are over 0.5C or it was actually 15,200 days over 0.5C.
E.g. an calculated daily GMST anomaly of 1.47C (below 1.5C) could be 1.52C (above 1.5C)
For 1940 -> May 2024 this means that there are 535 days above 1.5C, with a range of TODO: 520 – 545 days.
For a whole year GMST anomaly, the values should be accurate to within 0.01C
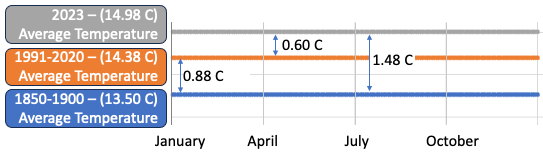
How hot was 2023, or any period which is a multiple 12 month period?
If you are comparing the average temperature for one year against the 1850-1900, then Copernicus states that you need to add 0.88C to the anomaly calculated against Copernicus’s own 1991-2020 baseline.
This also works, when you are want anomalies for 12 month periods E.g. March 2023 -> Feb 2024, or indeed any multiple of 12 month periods (Feb 2020 -> Jan 2024).
How hot was this month, this week, or this day
Sub-Annual GMST Anomalies (monthly, weekly, daily) is more problematic. If you need an accuracy of < 0.05C, then things get tricky.
For any given year, the daily GMST shifts up and down (E.g. Even globally, January is around 4C colder than July).
- To get the GMST for March 2024, you need to compare it to the the baseline March GMST for 1850-1900.
- To get Global Anomaly for 23rd April 2024 you need to compare it the the 1850-1900 baseline for 23rd April.
Additionally handling leap years requires judgement. Is 29th Feb 2024 comparable to 1st March baseline, or comparable to the mid-point between 28th Feb and 1st March baseline.
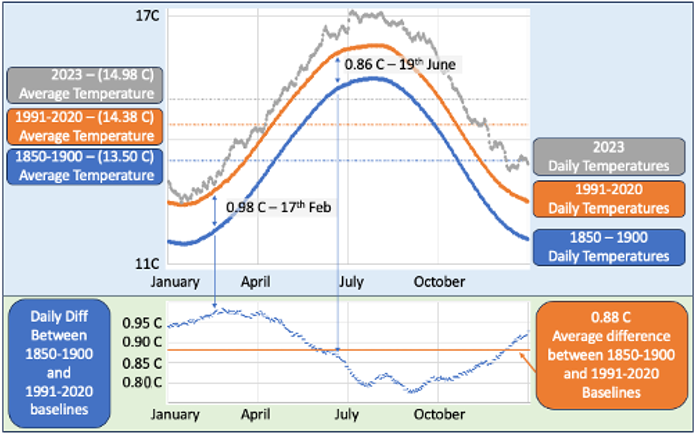
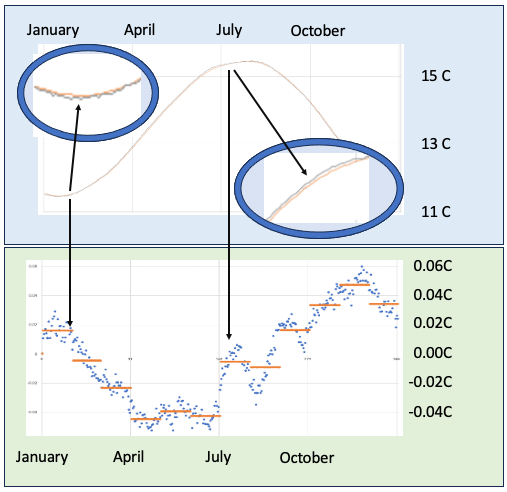
Graphs above show:
- Top graph
- 2023 GMST Values – from Copernicus
- Daily Average GMST for 2023 (Sinusoidal Grey line)
- Yearly Average GMST for 2023 (14.98C – Horizontal grey line)
- 1991-2020 Average GMST Values – from Copernicus
- Daily Average GMST for period 1991-2020 (Sinusoidal orange line)
- Average GMST for period 1991-2020 (14.38C – Horizontal orange line)
- 1850-1900 – Average GMST Values – from Copernicus
- Daily Average GMST for period 1850-1900 (Sinusoidal blue line)
- Note: Not using Copernicus Data. Must be derived somehow
- Average GMST for period 1850-1900 (13.50C – Horizontal blue line)
- Note: 0.88C less than the average temperature for 1991-2020
- Daily Average GMST for period 1850-1900 (Sinusoidal blue line)
- 2023 GMST Values – from Copernicus
- Bottom Graph
- Daily difference between 1850-1900 daily average GMST values and 1991-2020 daily average GMST values
- Note: The difference varies across the year,
- E.g. the Daily 1850-1900 GMST is NOT just 0.88C below the daily 1991-2020 GMST
- Highest difference of 0.98C in Late February
- Lowest difference of 0.77C in early September
- Note: The difference varies across the year,
- Daily difference between 1850-1900 daily average GMST values and 1991-2020 daily average GMST values
Still Doesn’t seem that complicated, right?
We just need two things:
- Temperature for the day(s) of the year we are interested in
- Baseline Temperature for the same day(s) of the year
Appendix A – Copernicus Daily GMST Values – Datasets
Copernicus gives daily 2m global average air temperature, from 1st Jan 1940, until today
- Data Set: A (Pulse with 1991-2020 baseline. https://pulse.climate.copernicus.eu/
- https://sites.ecmwf.int/data/climatepulse/data/series/era5_daily_series_2t_global.csv
- Downloaded on 3-Jun-2024, Saved as “GMST_Dataset_A_era5_daily_series_2t_global.csv”
- Updated daily, and includes the anomaly relative to 1991-2020 baseline
- Accuracy 2 decimal places
- https://sites.ecmwf.int/data/climatepulse/data/series/era5_daily_series_2t_global.csv
- Data Set: B (ReAnalyzer – purely shows daily global temperatures)
- https://climatereanalyzer.org/clim/t2_daily/json/era5_world_t2_day.json
- Downloaded on 3-Jun-2024, Saved as: “GMST_Dataset_B_era5_world_t2_day.json”
- Updated daily, and used for the reanalyzer graph
- https://climatereanalyzer.org/clim/t2_daily/?dm_id=world
- Accuracy 3 decimal places
- https://climatereanalyzer.org/clim/t2_daily/json/era5_world_t2_day.json
- Data Set C (Static with 1850-1900 baseline)
- https://climate.copernicus.eu/sites/default/files/custom-uploads/Page%20Uploads/daily_global_t2m.csv
- Downloaded on 3-Jun-2024, Saved as: “GMST_Dataset_C_daily_global_t2m.csv”
- Static file (1940 -> June 2023), but has daily values to adjust to the paris 1850-1900 baseline
- Accuracy 3 decimal places
- This file is used in a Copernicus article:
- https://climate.copernicus.eu/tracking-breaches-150c-global-warming-threshold
- https://climate.copernicus.eu/sites/default/files/custom-uploads/Page%20Uploads/daily_global_t2m.csv
The average temperature (1940 -> May 2024) is virtually identical:
- Data Set A (Pulse): 14.03010893
- Data Set B (Re-analyzer): 14.03053306
- Data Set C (Static): 14.03012458
Date Source A is 2-decimal-places, Data Source B, is 3-decimal-places, so you would expect all the values to be within 0.005 of each other.
This is mostly true, except in the 1970’s, with for some reason has a bigger variation.
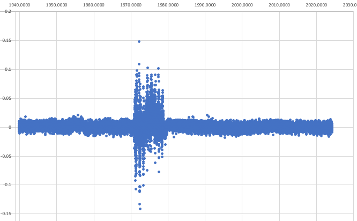
Data Source C is virtually identical to Data Source A
Again the 2dp vs 3dp accuracy means 0.005 difference
… but in 2000-> 20007, the difference jumps to 0.015
Overall, the benefit of the DataSet A, is that
It is direct from https://sites.ecmwf.int/data/climatepulse/data/series
and is updated a few days earlier.
Appendix B – Daily GMST for 1850-1900 Baseline
Baseline Calculation Option 1 (Static CSV file):
The “Data Set C” csv file (See Appendix A), explicitly includes the daily temperatures Jan-1st -> Dec 31st which would give you 1.5C over paris, and 2.0C over paris. This means you can get the daily values for the 1850-1900 baseline.
You need to decide what to do with leap years.
My default is to assume that feb 29th is midway between 28th Feb and 1st March.
Note that if you look at the CSV file, you will see this is also what Copernicus did
Baseline Calculation Option 2 (Trigonometry 1850-1900 Baseline Method):
The “Data Set A” (See Appendix A, “Pulse” Data set A), includes the daily anomaly between the daily GMST temperature and the 1991-2020 baseline.
- Baseline 1850-1900 daily GMST calculated as follows, for each day of the year
- Non-Leap year Baseline 1850-1900 Daily GMST:
- Average 1991-2020 Copernicus daily baseline GMST calculated from “climatepulse” link above (For the desired day of the year)
- minus
- 0.88+0.05sin((23.14159(B2-0.5))/365)+0.07cos((23.14159(B2-0.5))/365)
- Where “B2” is the desired day of the year. E.g. 1st Jan = 1, 1st Mar = 60, 31st Dec = 365
- Leap year Baseline 1850-1900 Daily GMST:
- Average 1991-2020 Copernicus daily baseline GMST calculated from “climatepulse” link above (For the desired day of the year)
- minux
- 0.88+0.05sin((23.14159(B2-0.5))/366)+0.07cos((23.14159(B2-0.5))/366)
- Where “B2” is the desired day of the year. E.g. 1st Jan = 1, 1st Mar = 61, 31st Dec = 366
- Non-Leap year Baseline 1850-1900 Daily GMST:
This technique gives you the daily GMST for the 1850-1900 baseline
This means you can now calculate daily/weekly/monthly GMST anomalies relative to 1850-1900, which match those published by Copernicus themselves
Baseline Calculation Option 3:
Copernicus provides Monthly Bulletins, which give information about the global temperature
- https://climate.copernicus.eu/surface-air-temperature-march-2024
- https://climate.copernicus.eu/surface-air-temperature-february-2024
- https://climate.copernicus.eu/surface-air-temperature-january-2024
- https://climate.copernicus.eu/global-climate-highlights-2022
- https://climate.copernicus.eu/esotc/2021/globe-in-2021
- https://climate.copernicus.eu/copernicus-2020-warmest-year-record-europe-globally-2020-ties-2016-warmest-year-recorded
- https://climate.copernicus.eu/copernicus-2019-was-second-warmest-year-and-last-five-years-were-warmest-record
This technique doesn’t give you daily GMST baseline values, however it gives you GMST Anomaly data points for specific months, days and years. These can be used as a Sanity check, to evaluate which of “Baseline calculation 1” or “Baseline calculation 2” give the best results.
Evaluating the best 1850-1900 Baseline
As per the sections above (within Appendix B), I have found 3 different ways in which the Copernicus 1850-1900 baseline daily temperatures are provided.
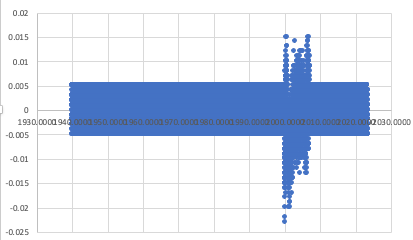
If we compare Baseline 1850-1900 GMST calculated from Option 1 vs Option 2…
As per top graph below, they both create an 1850-1900 baseline with near identical average daily GMST between 11C (Feb) and 16C (July), throughout the year. The circled enlarged areas show there is a small difference between the daily GMST provided by Option 1 vs Option 2.
The bottom graph below shows the daily difference between GMST values from Option 1 vs Option 2 (blue dots), and the monthly difference (orange horizontal lines). This shows that there is a range of -0.05C … + 0.06C difference on some days.
If you take the average GMST for the whole year, then Option 1 vs Option 2 is almost identical: 0.0019 C difference.
The Third way of finding the 1850-1900 baseline only gives me monthly values (but these are the values published by Copernicus, and therefore the gold standard as far as I’m concerned).
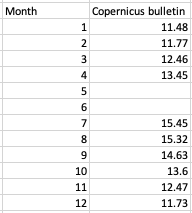
The top graph below, shows monthly GMST values calculated with Option 1, Option 2 and Option 3. All represent the 1850-1900 baseline GMST.
As you can see, they are very similar, but there are some differences.
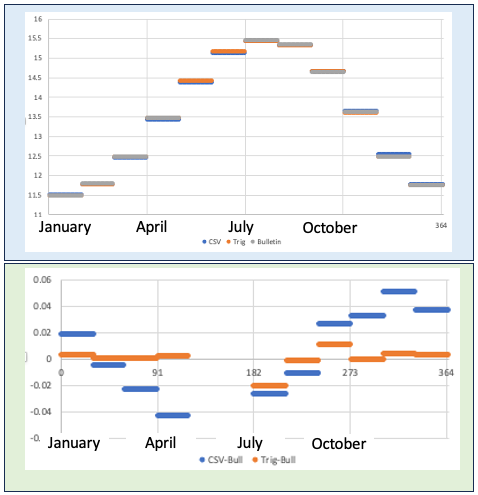
The bottom graph above shows:
- Difference between Option 1 and Option 3 (Blue)
- Difference between Option 2 and Option 3 (Orange)
As you can see, Option 2 is closer to Option 3 (and Option 1 has bigger differences)
I will there fore be using Option 2 to give me the daily baseline temperatures for 1850-1900
Previously (Feb 2024) I was using “Option 1” … and this explains why I was seeing differences between the daily / monthly values I was calculating, vs those being posted on Copernicus website.
Now that I am moving to “Option 2”, I should have a very tight correlation between my analysis and that posted by Copernicus, as we should now be using the same data and the same techniques.