Listening to reporting of “How Warm is the Planet” is deeply frustrating. The same article can mix different information
Key Attributes to be Wary of when talking about global temperatures
- Baseline Temperature
- Which year is zero degrees
- “Pre-industrial” – a vague term used in the Paris Agreement
- 1750 – Older IPCC reports (30 years centred on 1750)
- More accurate date for “Pre-Industrial” but less reliable global data
- 1850-1900 – Newer IPCC reports including the IPCC SR 1.5 Report
- De-facto standard zero value for “Pre-Industrial”
- Much better data from this date
- 1750 – Older IPCC reports (30 years centred on 1750)
- 1880-<some date> – Used by GISSTemp (Nasa)
- Need to watch out for what that “Some date” is, each time.
- “Current Climate”
- Using a 30-year running average is a standard Meteorological practice
- By definition this means a “shifting baseline”.
- If you are interested in temperatures relative to “Pre-industrial”, you need to check for the right offset.
- “Pre-industrial” – a vague term used in the Paris Agreement
- Which year is zero degrees
- Dataset
- There are multiple organisations / techniques used to determine the “Temperature Anomaly”
- This website uses NOAA, GISSTemp, Berkeley Earth, Copernicus, HadCRUT (See GMST Data Sets)
- Timelines
- Is the reporter talking about the global temperature anomaly
- Today
- This month
- Running 365 days
- Calendar year
- “The Climate”
- Running 30 year average
- Running 15 year average
- Centred 20 years with climate models for future 10 years
- a.n.other
- Is the reporter talking about the global temperature anomaly
Variations Between Global Temperature Data Sets
As per image below, each of the GMST Data Sets (NOAA, GISSTemp, HadCRUT, Berkeley Earth, Copernicus ERA-5) have been smoothed with “Loess Smoothing” (See Climate Milestones – NOAA, GISS, Copernicus, HadCRUT, Berkeley Earth page for smoothing technique). It shows that the big differences in the “Global Temperature Anomaly” happened before 1970, all have the very similar trend lines after that. In essence they all agree how much the earth has warmed since 1970, but have significant variance before that.
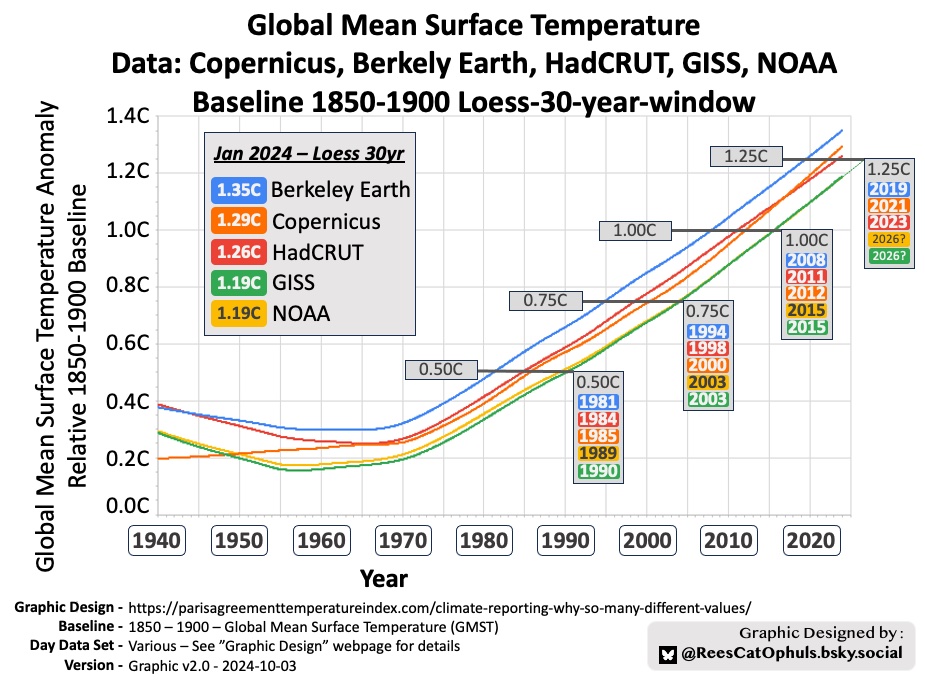
Below is the same graph as above, but zoomed in and labeled.
It shows:
- Berkeley Earth is the warmest
- Copernicus and HadCRUT are in the middle
- NOAA / GISSTemp both run coldest
- The difference means about 0.17C difference in “The Climate” that these data sets report
- In other words, assuming continued rising temperatures, NOAA / GISSTemp will likely report the same temperature as Berkeley Earth, but about 7 years later

Variations Between Data Smoothing
As per graphics
- Climate Milestones – NOAA, GISS, Copernicus, HadCRUT, Berkeley Earth
- Climate Milestones Copernicus – ERA5
… you can see that the monthly global temperature values jump around a lot year-2-year, and the graphics have “smoothing lines” applied to them. This is useful to get a reasonable steady sense of the current climate. For me, the “Loess Smoothing” with a 30-year-window gives a good balance between following the data accurately, without being too jumpy, or too unresponsive to decadal trends.
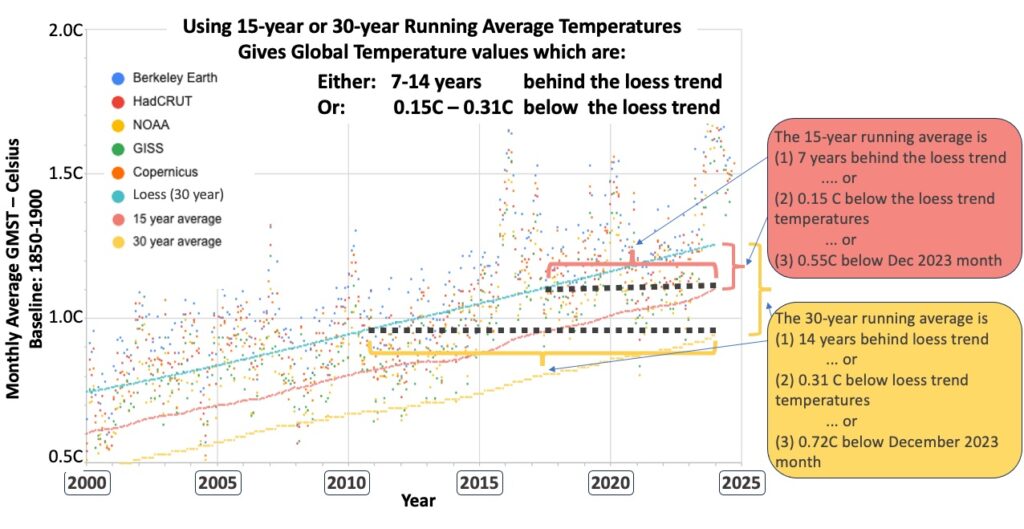
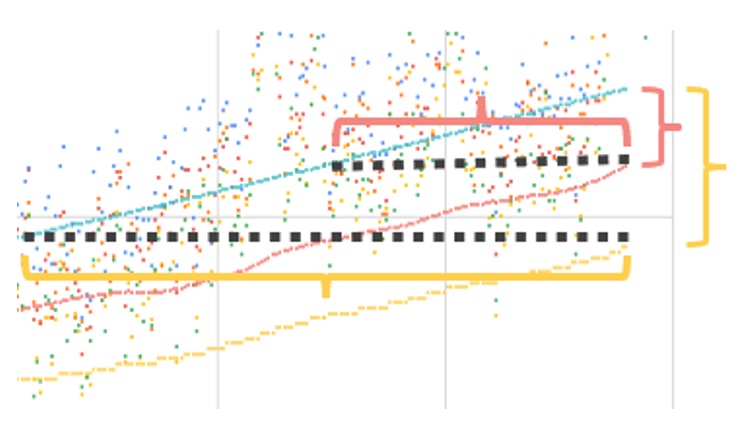
As per the graph below, the Loess Smoothing seems overlays the actual data. Compare with running-average smoothing:
- Using the 15-year-running average
- You get “GMST Trend Temperature” values which are about 0.15C below what we are experiencing
- You get “GMST Trend Temperature” values which are what we experienced 7 years ago
- Using the 30-year-running average
- You get “GMST Trend Temperature” values which are 0.31C below what we are actually experiencing
- You get “GMST Trend Temperature” values which are what we experienced 14 years ago.
- If we are looking to find the current “GMST Trend Temperature” (E.g. what to expect looking forwards), then I view this as very weak. Especially if “crossing Paris Agreement 1.5C / 2.0C” is evaluated against this technique.