Easy reference to some of the mistakes / improvements I have made.
Errata 2026 – February
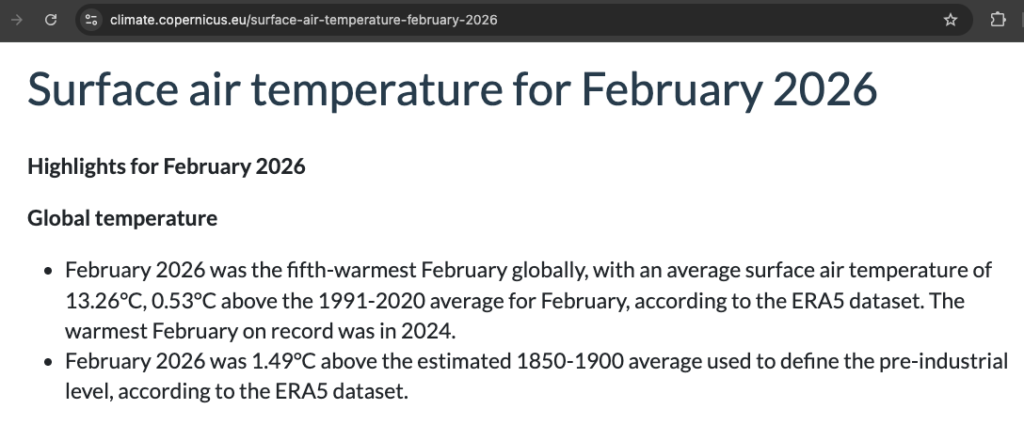
After a long run of aligning perfectly with Copernicus’s Monthly bulletins, My Feb 2026 Monthly average is 1.50, whereas Copernicus https://climate.copernicus.eu/surface-air-temperature-february-2026 … has 1.49C. This is annoying for me personally. As per Copernicus 1850-1900 Baseline – Daily GMST Anomaly … I don’t get the Global Warming anomalies directly from Copernicus. I have to reverse engineer them. I may only be 0.005C out (which then becomes 0.01C out after rounding to 2dp), but still, it is annoying. Particularly for when I next update the graphic °C Milestones – From First Appearance to Permanence … which counts the number of months per year at-or-above 1.5C and other milestones. I’ll have to work out what to do… Accept the difference, or change my adjustment maths, but that will mess up other graphics like the 1000 Days above 1.5C before Trend passes 1.5C? graphic. Hmmmph… What to do.
Errata 2025 – December
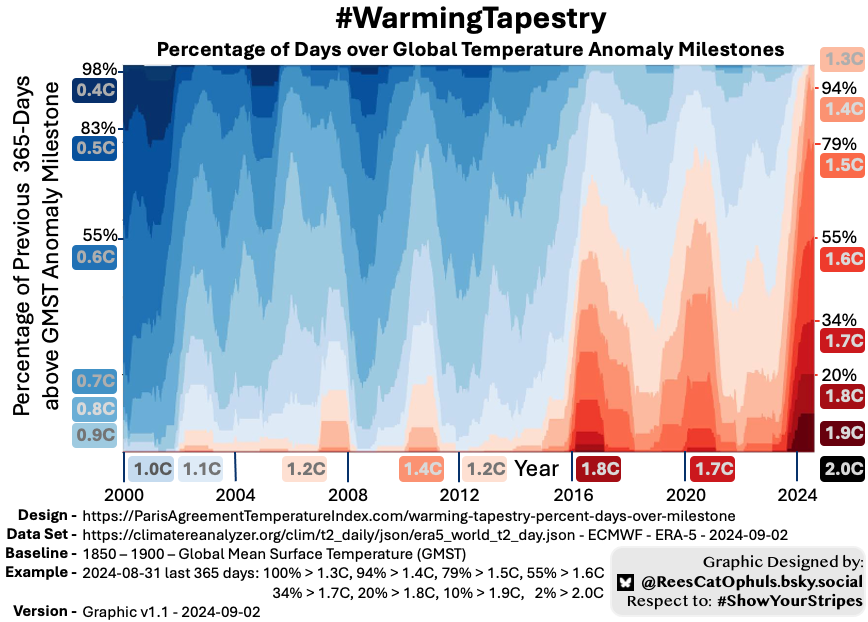
I noticed I made a typo in my November 2025 update for Warming Tapestry. The top left date should be “1st Jan 2000” (not the “1st Jan 2020” which is in the image). I’ll fix that as part of the next post for that graphic.
When I try using Global Warming Baseline Adjustments table for NASA GISS and the 1981-2010 period, I’m suspicious that +0.71C is too high. I’ll have to do some more analysis on that.
Errata 2025 – October
As far as I’m aware, I haven’t made any mistakes in the last year.
Errata 2024 – October
As per Log of Updates (October 2024) and Improved Smoothing Function – Loess (October 2024), I have updated the website graphics and text, to use “Loess smoothing” with 30-year-window for my graphics, to give the trend lines. This is a much more standard technique than my previous hand-made smoothing technique. I always thought someone must have done the work better, but took a while for me to find it.
Errata – 2024 – September
My original version of 1000 Days above 1.5C before Trend passes 1.5C? had a few issues.
- As per section lower down, I have improved my calculations for the copernicus data relative to 1850-1900. This meant that the second version of the graphic has improved numbers, but someone looking closely comparing v1 (March 2024) and v2 (September 2024), they would notice that some of the numbers don’t go up as one might expect.
- The “Climate passes” values were a bit controversial, and used a home-grown non-standard smoothing function I came up with. For v2, I have replaced this with Loess smoothing with a 30 year window. This means the years I have posted for passing various anomalies has changed a bit (not much), but is it more standard.
Errata – 2024 – September – Poor labelling of “Quadratic” / “Linear”
Looking to fix some loose language on the website (more to come).
I labelled some of the trend lines as “Quadratic” or “Linear”, whereas they were actually: “centre-moving-best-fit using quadratic / linear” … E.g. given a data point, take x-years of data from either side, and calculate the best linear / quadratic fit for that date. Then for the next data point start again.
This gave some nice fitting lines, except for the ends, and the first/last points in the trend really were pure linear or pure quadratic best fit. E.g. if the centre-moving part was using 20 years (10 years either side), then start/end were just using 10 years-after (for the first point), and 10-years-before for the last point.
I think I’ll move to Loess smoothing from now on, as that is a standard, and not semi-home-grown.
Errata – 2024 – Summer – Improved data handling
After trying to work out why my Copernicus calculations were often slightly different from that posted by the Copernicus official account (we’re talking < 0.05C level of difference)… I spent ages trying to get my results (which use the copernicus data, and the copernicus methods), to match those published by Copernicus. See rather dull article Copernicus 1850-1900 Baseline – Daily GMST Anomaly
The next time I update the 1000 Days above 1.5C before Trend passes 1.5C? graphic, it will use this improved method. This adjusts some “daily temperature anomalies relative 1850-1900” by under 0.05C, and therefore around some of the numbers from the first version of this graphic, won’t appear to match well with the update. E.g. the number of days over X may not go up as much as maths would suggest, when comparing the graphics.