Log 2026 July – Update
Update to the Warming Tapestry (percent of last 365 days, over given milestones) – We may have bottomed out, the dip, as we enter into the effects of the growing (Super ?) El Nino.
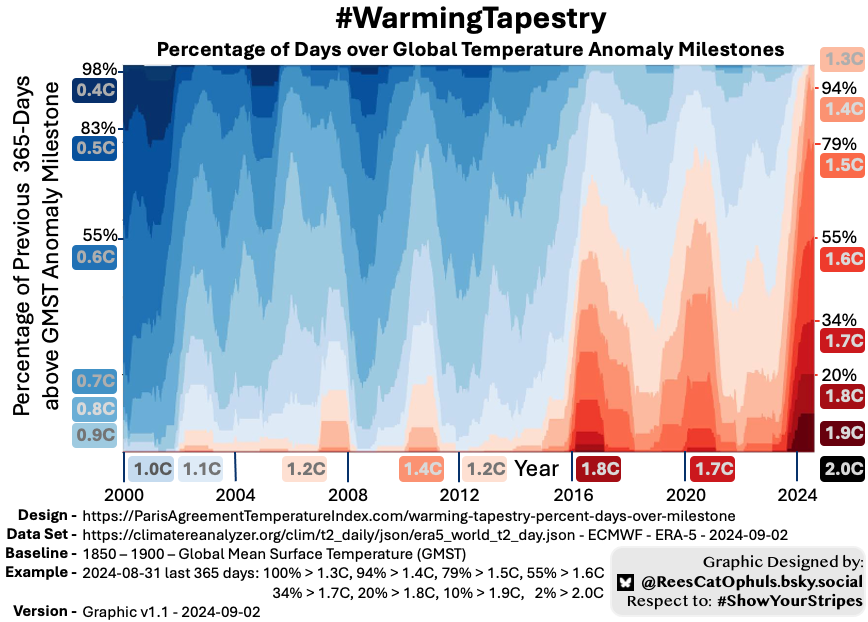
Update to the Spiral of Global Heat – with data up to the start of July.
Log – 2026 May – Update
Added update to Longest Running Average, as the 3.5 year average is crossing 1.5C with the ERA5 data.
Log – 2026 January – Update
Added Global Warming Futures Series page, and posted graphics on BlueSky for GWFS – 1 – Hansen, GWFS – 2 – Quadratic and GWFS – 3 – Highest Possible Ambition. These show when we might get the first / last time we get day / month / year that is over / under a global warming milestone.
Log – 2026 January – Update
Modified the Climate Graphics page include thumbnail images, to make it easier to see which graphics are available. Updated the counts on the home page carousel, and the numbers in the images below the carousel.
Log – 2025 December – Update
Updated °C Milestones – From First Appearance to Permanence with the 2025 data
Added update to Errata page. Minor typo in Warming Tapestry , and I’m a bit suspicious of the +0.71C number in Global Warming Baseline Adjustments for Nasa GISS data.
Log – 2025 December – Update to Spiral Warming
Updated Spiral of Global Heat with the latest data (up to mid December 2025) and posted to BlueSky.
Log – 2025 November – CO2 (ppm), Warming Stripes, Conferences
CO2 – Global Warming Stripes – Conferences – Following a request on BlueSky from Tadzio Mueller (requested out to the internet in general), I made an update to this classic graphic.
Log – 2025 November – Longest Running Average
To mark the 3-year-running average crossing 1.5C (Copernicus and Berkeley Earth data), I added Longest Running Average graphic, which shows what the longest running average is for 1.5C on any date, and also for other global warming milestones
I have been posting updates to the other graphs over the year. E.g.
- 1000 Days above 1.5C before Trend passes 1.5C?
- Warming Tapestry Percent Days Over Milestone
- °C Milestone Counts – Days – Months – Trend
Log – 2024 November – Global Heating Spiral
Added Spiral of Global Heat graphic video, and posted to BlueSky and TwitterX
Log – 2024 October – Graphic – Shifting Seasons
Added Globally Shifting Seasons graphic video, and posted to BlueSky and TwitterX
Log – 2024 October – Move to Loess Smoothing
While comparing my work to that of others, I started to notice that “Loess” was a popular smoothing technique. I had come up with my own smoothing technique which wasn’t ideal and wasn’t great at the start/end of the trend line. Also I was labelling it pretty poorly.
I have updated all the graphics and analysis to use Loess (with a 30 year window of data).
See post: Improved Smoothing Function – Loess – which points to the older graphs
Log – 2024 September – Record Warmest Days through time
Posted Hottest Days On Record Through The years to BlueSky and TwitterX
Log – 2024 September – Warming Tapestry
Posted Warming Tapestry Percent Days Over Milestone to BlueSky and Twitter|X
Log – 2024 August – Created Blue Sky account
I seem to have followed a trend in UK to move to BlueSky: @ReesCatOphuls.bsky.social
Log – 2024 April -5th
@EliotJacobson kindly posted on X, my second graphic: 1000 Days above 1.5C before Trend passes 1.5C?
Log – 2024 – March
Got properly taken out by covid. … Turned out to be ongoing for many months.
Log – 2024-April-1st
Website went live. Mostly to host explanations of the graphics I post on Twitter, under handle @ReesCatOphuls
Log – 2024-Feb-20
@EliotJacobson kindly posted on X, my first graphic: °C Milestones – From First Appearance to Permanence