(Back to Global Warming Baseline Adjustments page)
Copernicus Baseline Conversions
Evidence: Copernicus Baseline Conversions – Baseline 1991-2020
Evidence: Ref-Cop-1991_2020_Year:
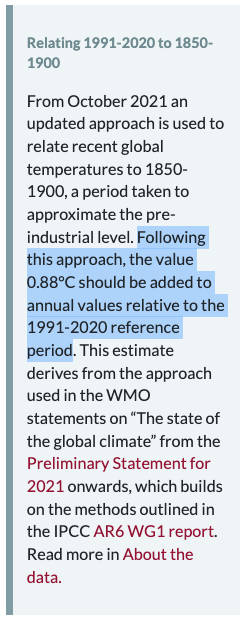
When converting anomaly for a full year (or any multiple of 12 months), from 1990-2020 baseline, to 1850-1900 baseline, add 0.88C


Copernicus Evidence Individual Months
When looking for the adjustment for individual months.
E.g. If graph shows “September 2024 was 0.7C warmer than 1991-2020 baseline”, then you can’t just add 0.88C (As per previous heading about comparing full years).
The offset I show (for individual months) in the table at the top of this page is calculated (see Copernicus 1850-1900 Baseline – Daily GMST Anomaly for a detailed explanation and method), and I compare it to details published on Copernicus’ own websites and/or BlueSky posts. Note that the values in the table above are 3 decimal places, whereas those on Copernicus website tend to be 2 decimal places, so a deviation of up to 0.005 is to be expected.
Evidence: Ref-Cop-1991_2020_Jan
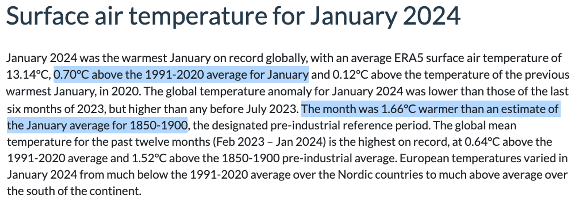
When converting the individual month of January (baselined 1991-2020), to be baselined to 1850-1900 baseline period add 0.960C (0.96C). (See heading “Evidence Individual Months” above, regarding the difference in accuracy 2dp vs 3dp).
Evidence: Ref-Cop-1991_2020_Feb:
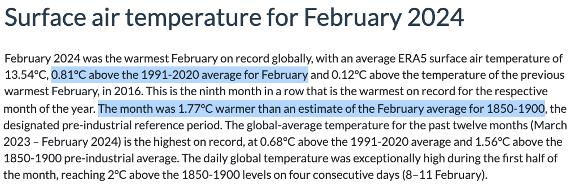
When converting the individual month of February (baselined 1991-2020), to be baselined to 1850-1900 baseline period add 0.964C (0.96C). (See heading “Evidence Individual Months” above, regarding the difference in accuracy 2dp vs 3dp).
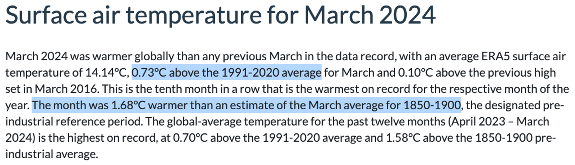
Evidence: Ref-Cop-1991_2020_Mar:
When converting the individual month of March (baselined 1991-2020), to be baselined to 1850-1900 baseline period add 0.947C (0.95C). (See heading “Evidence Individual Months” above, regarding the difference in accuracy 2dp vs 3dp).
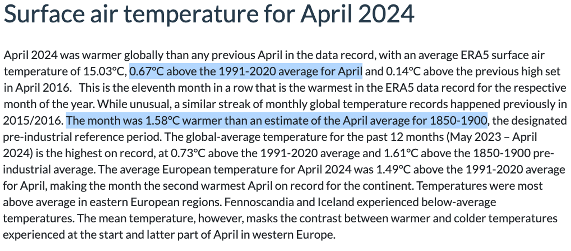
Evidence: Ref-Cop-1991_2020_Apr:
When converting the individual month of April (baselined 1991-2020), to be baselined to 1850-1900 baseline period add 0.912C (1.58C – 0.67C = 0.91C). (See heading “Evidence Individual Months” above, regarding the difference in accuracy 2dp vs 3dp).
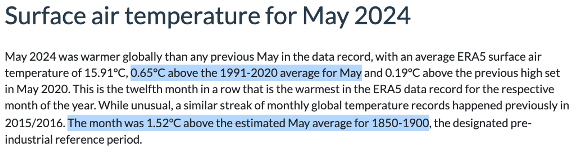
Evidence: Ref-Cop-1991_2020_May:
When converting the individual month of May (baselined 1991-2020), to be baselined to 1850-1900 baseline period add 0.868C (1.52C – 0.65C = 0.87C). (See heading “Evidence Individual Months” above, regarding the difference in accuracy 2dp vs 3dp).
Evidence: Ref-Cop-1991_2020_Jun:
When converting the individual month of June (baselined 1991-2020), to be baselined to 1850-1900 baseline period add 0.828C (1.50C – 0.67C = 0.83C). (See heading “Evidence Individual Months” above, regarding the difference in accuracy 2dp vs 3dp).

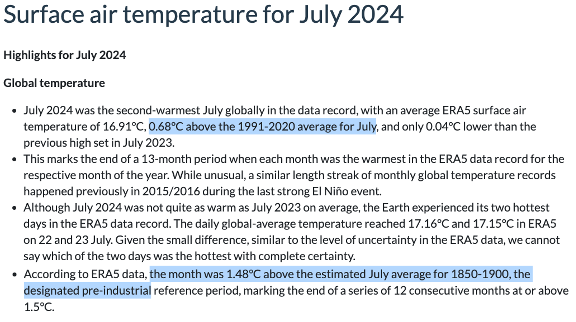
Evidence: Ref-Cop-1991_2020_Jul:
When converting the individual month of July (baselined 1991-2020), to be baselined to 1850-1900 baseline period add 0.801C (1.48C – 0.68C = 0.80C). (See heading “Evidence Individual Months” above, regarding the difference in accuracy 2dp vs 3dp).
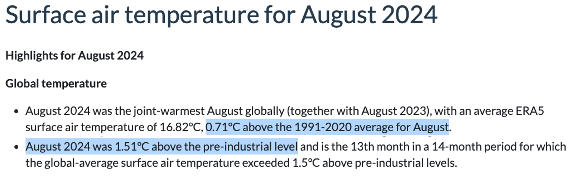
Evidence: Ref-Cop-1991_2020_Aug:
When converting the individual month of August (baselined 1991-2020), to be baselined to 1850-1900 baseline period add 0.796C (1.51C – 0.71C = 0.80C). (See heading “Evidence Individual Months” above, regarding the difference in accuracy 2dp vs 3dp).
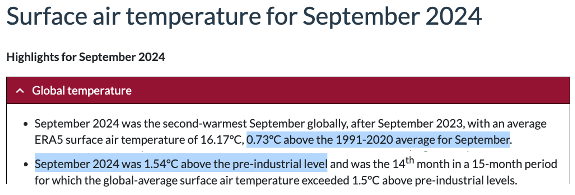
Evidence: Ref-Cop-1991_2020_Sep:
When converting the individual month of September (baselined 1991-2020), to be baselined to 1850-1900 baseline period add 0.814C (1.54C – 0.73C = 0.81C). (See heading “Evidence Individual Months” above, regarding the difference in accuracy 2dp vs 3dp).
Evidence: Ref-Cop-1991_2020_Oct:
When converting the individual month of October (baselined 1991-2020), to be baselined to 1850-1900 baseline period add 0.850C (1.65C – 0.80C = 0.85C). (See heading “Evidence Individual Months” above, regarding the difference in accuracy 2dp vs 3dp).

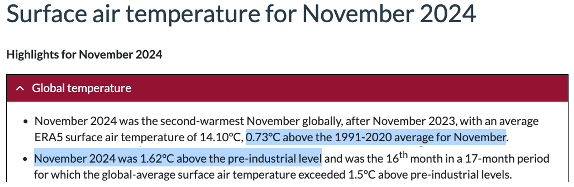
Evidence: Ref-Cop-1991_2020_Nov:
When converting the individual month of November (baselined 1991-2020), to be baselined to 1850-1900 baseline period add 0.894C (1.62C – 0.73C = 0.89C). (See heading “Evidence Individual Months” above, regarding the difference in accuracy 2dp vs 3dp).
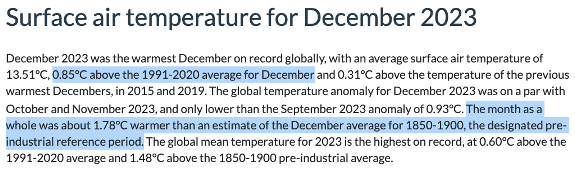
Evidence: Ref-Cop-1991_2020_Dec:
When converting the individual month of December (baselined 1991-2020), to be baselined to 1850-1900 baseline period add 0.934C (1.78C – 0.85C = 0.93C). (See heading “Evidence Individual Months” above, regarding the difference in accuracy 2dp vs 3dp).
Evidence: Copernicus Baseline Conversions – Baseline 1981-2010
Evidence: Ref-Cop-1981_2010_Year – Part 1
If you look at “Part 2” (section below), there are images of charts, downloaded from https://climate.copernicus.eu/surface-air-temperature-december-2023
It is possible to download the csv files for the “monthly values” equivalent, for both of those graphs.
You can then compare the monthly anomalies… TODO. better analysis to be added here.
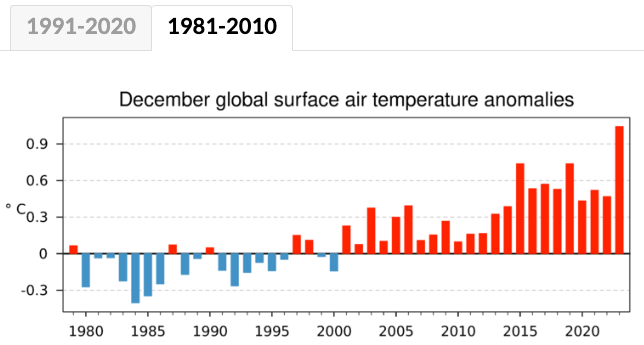
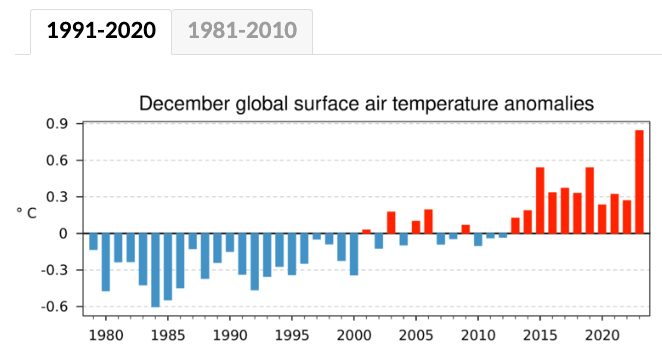
Evidence: Ref-Cop-1981_2010_Year – Part 2
As per the two images below, the top image uses the 1981-2010 baseline, and the bottom image uses the 1991-2020 baseline. As per the two relevant tables in Global Warming Baseline Adjustments, the “full year adjustment for 1991-2020” is +0.880C and the “full year adjustment for 1981-2010” is +0.688C, so you would expect the values in the top graph to be 0.192C higher (0.880C – 0.688C) than the values in the bottom graph. I did an exercise of overlaying the images onto each other, and this is true. You can also download the raw data from the source URL, and it matches that way too.
NOAA Baseline Conversions
NOAA – How numbers were calculated
As per GMST Data Sets, downloaded the NOAA file, with monthly … TODO
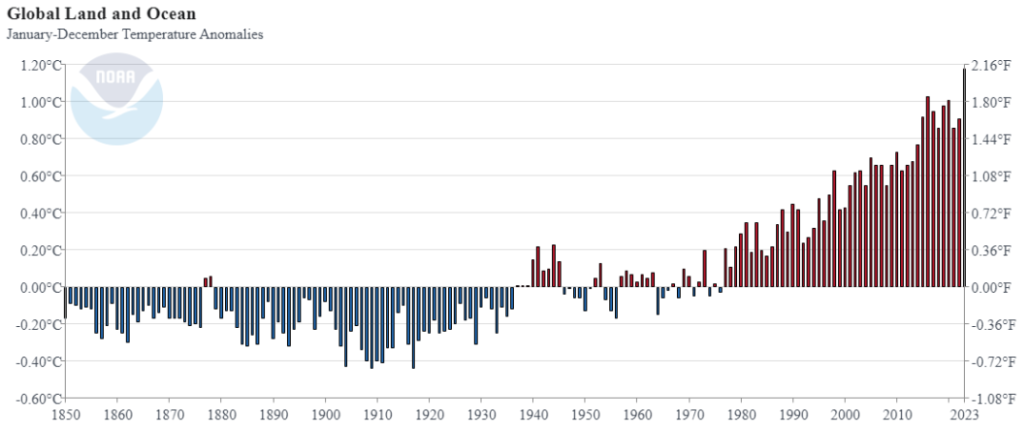
Evidence: NOAA Baseline Conversions – Baseline 1901-2000
NOAA has a page with the text and graph below, saying the 2023 was 1.18C above 20th century average (E.g. 1.18C above 1901-2000).

NOAA also has the statement:
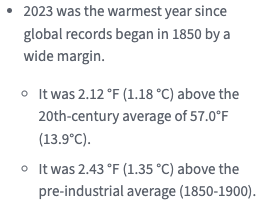
The text above says 2023 was 1.35C relative 1850-1900. The CSV from the graph above says relative 1901-2000, the 2023 temperature was 1.18). So to go from 1901-2000 baseline to 1850-1900 baseline, need (1.35C – 1.18C) to add 0.17C.

Berkeley Earth Baseline Conversions
Evidence: Berkely Earth Baseline Conversions – Baseline 1901-2000
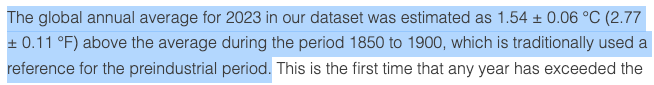
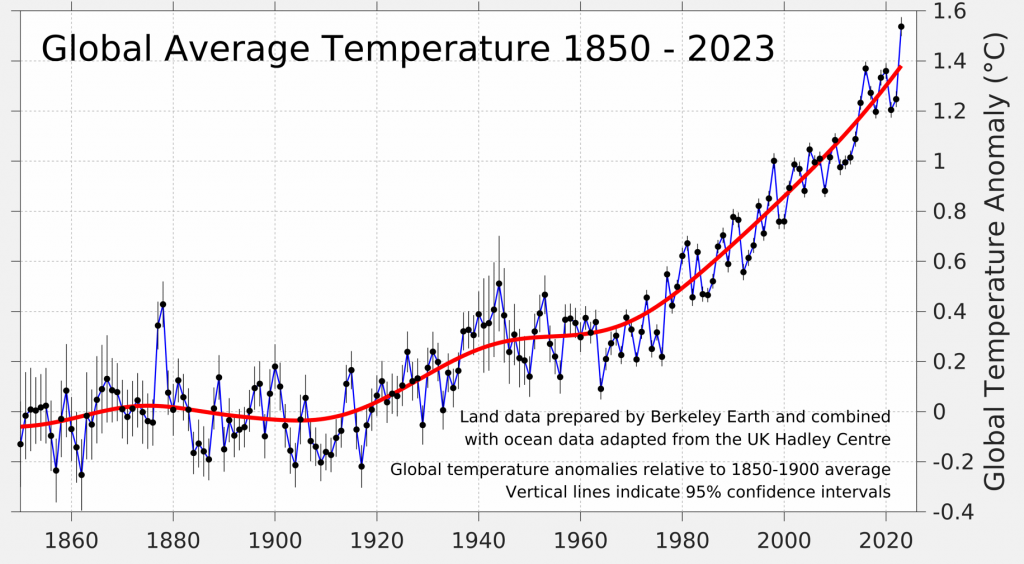
The page (https://berkeleyearth.org/global-temperature-report-for-2023) has the following temperatures, all baselined to 1850-1900.
- 2023: 1.54 °C
- 2022: 1.25 °C
- 2021: 1.20 °C
- 2020: 1.36 °C
- 2019: 1.33 °C
- 2018: 1.20 °C
- 2017: 1.27 °C
- 2016: 1.37 °C
- 2015: 1.23 °C
- 2014: 1.09 °C
- 2013: 1.01 °C
- 2012: 1.00 °C
- 2011: 0.98 °C
- 2010 1.08 °C
This graph below uses pre-industrial (1850-1900)

NASA GISS TEMP Baseline Conversions
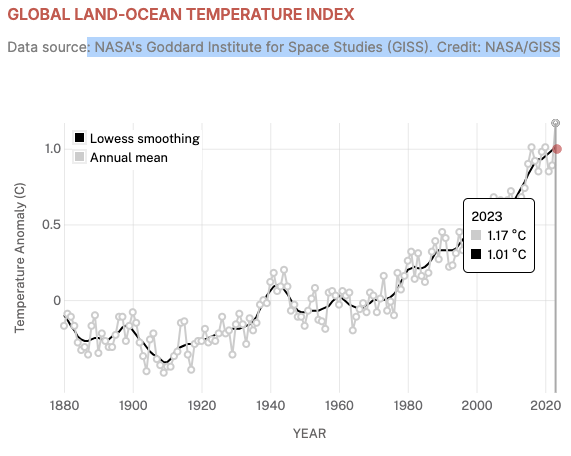
Evidence: Convert GISS TEMP (NASA) 1951-1980 baseline to 1850-1900
As per the work below, to go from NASA GISS Temp data baselined 1951-1980 … to 1850-1900 baseline, add (1.36C – 1.17C) = +0.19C.
Note that as per Climate Reporting – Why so many different values, run about 0.1C below Copernicus, and runs about 0.16C below Berkeley Earth.
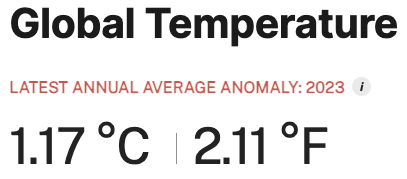
The text below shows that NASA/GISS have 2023 as being 1.36C above Pre-Industrial (1850-1900).

As below, the same page, says that 2023 anomaly for GISS/NAsa is 1.17C (which as per the notes lower down this section, I believe uses the 1951-1980 baseline).
… Which matches the data from the download file: https://data.giss.nasa.gov/gistemp/graphs/graph_data/Global_Mean_Estimates_based_on_Land_and_Ocean_Data/graph.txt
But the graph on the same page (which also shows 2023 as 1.17C seems to use an unspecified baseline),
This text below talks about using a 1951-1980 baseline (I mean, why not!. Every institution to themselves).
When I tried the data from (https://data.giss.nasa.gov/gistemp/graphs/graph_data/Global_Mean_Estimates_based_on_Land_and_Ocean_Data/graph.txt ) … and averaged the years 1951-1980 I did get zero (0.00033333C), so that matches.
Other Data
Global Data sets – Comparison
Below, is a useful check for my analysis about how high/low the different datasets are relative to each other. As expected, Berkeley is highest, then Copernicus. I’m surprised by the gap between NOAA and NASA, which in my experience are almost always the same, and also I would have expected Hadley to be closer to Copernicus. Still, these are projections in an article written in November 2024 by Zeke Hausfarther. I’ll revisit this when the final numbers are out.

Blue Sky – Peter Dutoit – Jan 2025
A useful piece of analysis, to help me cross check my work with someone else’s analysis.
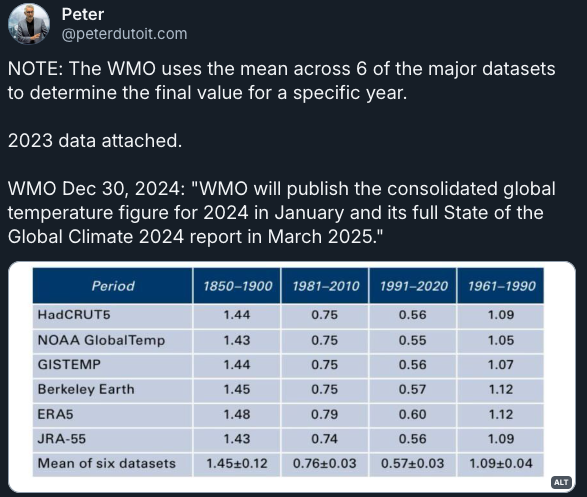
Graph with combined global datasets