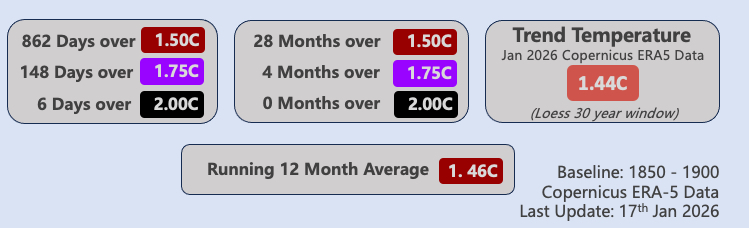
As per the image above, and the 1000 Days over 1.5C before Climate is over 1.5C graphic, we are fast ticking off individual days above the Paris Agreement of 1.5C making a start on days over 2.0C.
As per Key Climate Indicators, and there are plenty of factors which suggest that these values will continue to ratchet in the next decade.
The counts shown here are based on “Copernicus ERA-5” daily global 2m surface temperatures (see GMST Data Sets and Copernicus 1850-1900 Baseline – Daily GMST Anomaly). As per Climate Reporting – Why so many different values the Copernicus data is midway between “Berkeley Earth” (which runs 0.08C hotter) and “NOAA / GISSTemp” (which both run about 0.08C colder). All the GMST Data Sets I have been working with have virtually the same trends, with most of the difference in reported anomaly happening before the 1970s.