Globally, the hottest 86 days on record all happened in 2023 and 2024.
This got me wondering, how the “hottest days on record” progressed through the years.
The video shows the hottest 5-days (white), hottest 50-days (yellow), hottest 200-days (orange) which had been recorded between for a given date. E.g. the start shows the state of the record books in 1961, then the next frame shows the situation a year later.
Interesting Observations
- You can really see the surge in temperatures every few years. E.g. 1980/81, 1991, 1998, 2016, 2023/24.
- The max temperatures of the ranges jump during the surges
- The lowest temperature for the warmest 200 days tends to creep up more smoothly
- The first image (data from 1940…1961) has hottest temperature 15.97, while the last image (data from 1940…2024) has the hottest temperature 17.16 (E.g. max temp has gone up 1.2C in 63 years)
- Before the 1990’s the hottest-x-days-on-record appear to be more spread out
- E.g. in 1961, the hottest-50-days spreads between 1940 and 1961 (21 years)
- E.g. in 2000, the hottest-50-days spreads between 1987 and 1998 (11 years)
- E.g. in 2024, the hottest-50-days spreads between 2023 and 2024 (2 years)
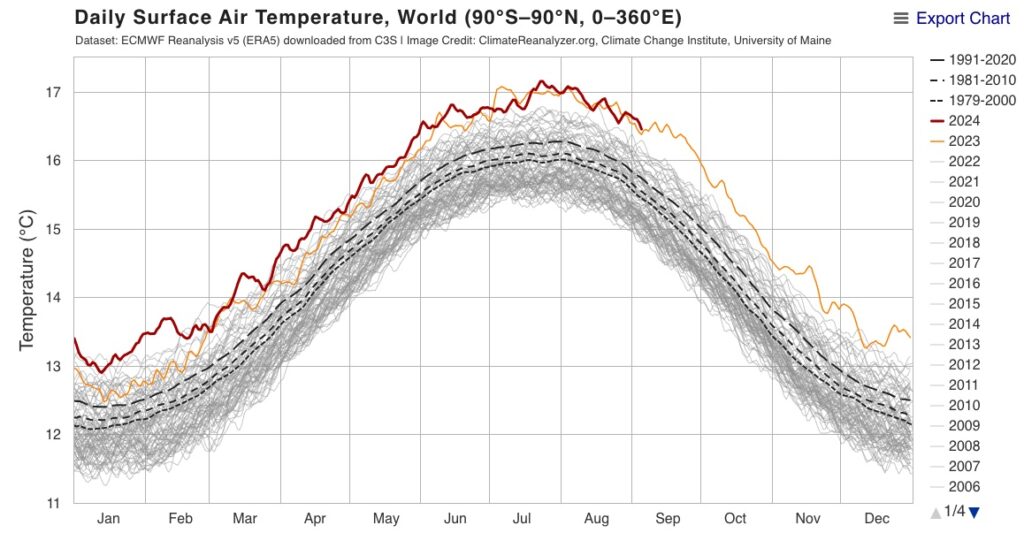
The temperatures are absolute global mean surface temperatures. As per image below, the record hottest days for any one year tend to occur between June and September. (https://climatereanalyzer.org/)
How This graphic was created
I used the “Copernicus ERA5” data, as per GMST Data Sets. This time, instead of trying to calculate the temperature anomaly, I was interested in the absolute GMST temperature, which is in the CSV file provided by Copernicus. I didn’t need to do any parsing / calculations, just use the temperature provided.
The left hand graph (The big one)
- Step 1: Take the years I was interested in.
- To find the hottest 5 / 50 / 200 days on record in 1961, just grab the data 1940 – 1961
- To find the hottest 5 / 50 / 200 days on record in 1962, just grab the data 1940 – 1962
- …
- To find the hottest 5 / 50 / 200 days on record in 2024, just all the data
- Note, I’m making a judgement no more years in 2024 will make it into the hottest 200 days, as we are heading away from peak summer (and the global temperature seems to be more aligned to the northern hemisphere summer)
- Step 2: Order the years by the GMST temperature
- E.g. for the 1940 – 1961 data, order that by temperature
- E.g. for the 1940 – 1962 data, order that by temperature
- …
- E.g. for the 1940 – 2024 data, order that by temperature
- Step 3: For each data set (1940 – 1960, 1940 – 1961, …, 1940 – 2024) create graph
- Step 4: Overlay the graphs onto a background image
- Step 5: Turn it into a gif
For the right hand graphic (The narrow one)
- Once I have the top 5 temperatures for a given year, take the highest and lowest temperatures
- … ditto the top 50 and top 200 temperatures
- Plot these in the graph on the right, to show the range of temperatures
Pretty simple really.